AI Application Observability
Introduction
With the rise of AI applications, it’s important to have observability in place. Especially when control flow is not as clear as traditional applications. This post will cover basic logs, metrics, traces using OpenTelemetry. Continuous profiling using Pyroscope. LLM observability using LangSmith.
OpenTelemetry
OpenTelemetry is a collection of APIs, SDKs, and tools. Use it to instrument, generate, collect, and export telemetry data (metrics, logs, and traces) to help you analyze your software’s performance and behavior.
The usual flow is to add OpenTelemetry SDK to application, then it can export telemetry data to various backends, like Prometheus, Tempo, or an OTEL collector.
Some SDK supports automatic instrumentation, for example in Python, you can add
pip install opentelemetry-distro[otlp] opentelemetry-instrumentation
Then run
opentelemetry-bootstrap -a requirements
It will list all the packages that need to be installed to instrument your application. Note that some instrumentation may crash the app due to bugs like this, cherry-pick the ones you need.
Then all options can be configured via environment variables, official doc.
Take the previous chat search example, entrypoint command changed to
opentelemetry-instrument uvicorn app.server:app --host 0.0.0.0 --port 8000
start local development with
docker compose up --build
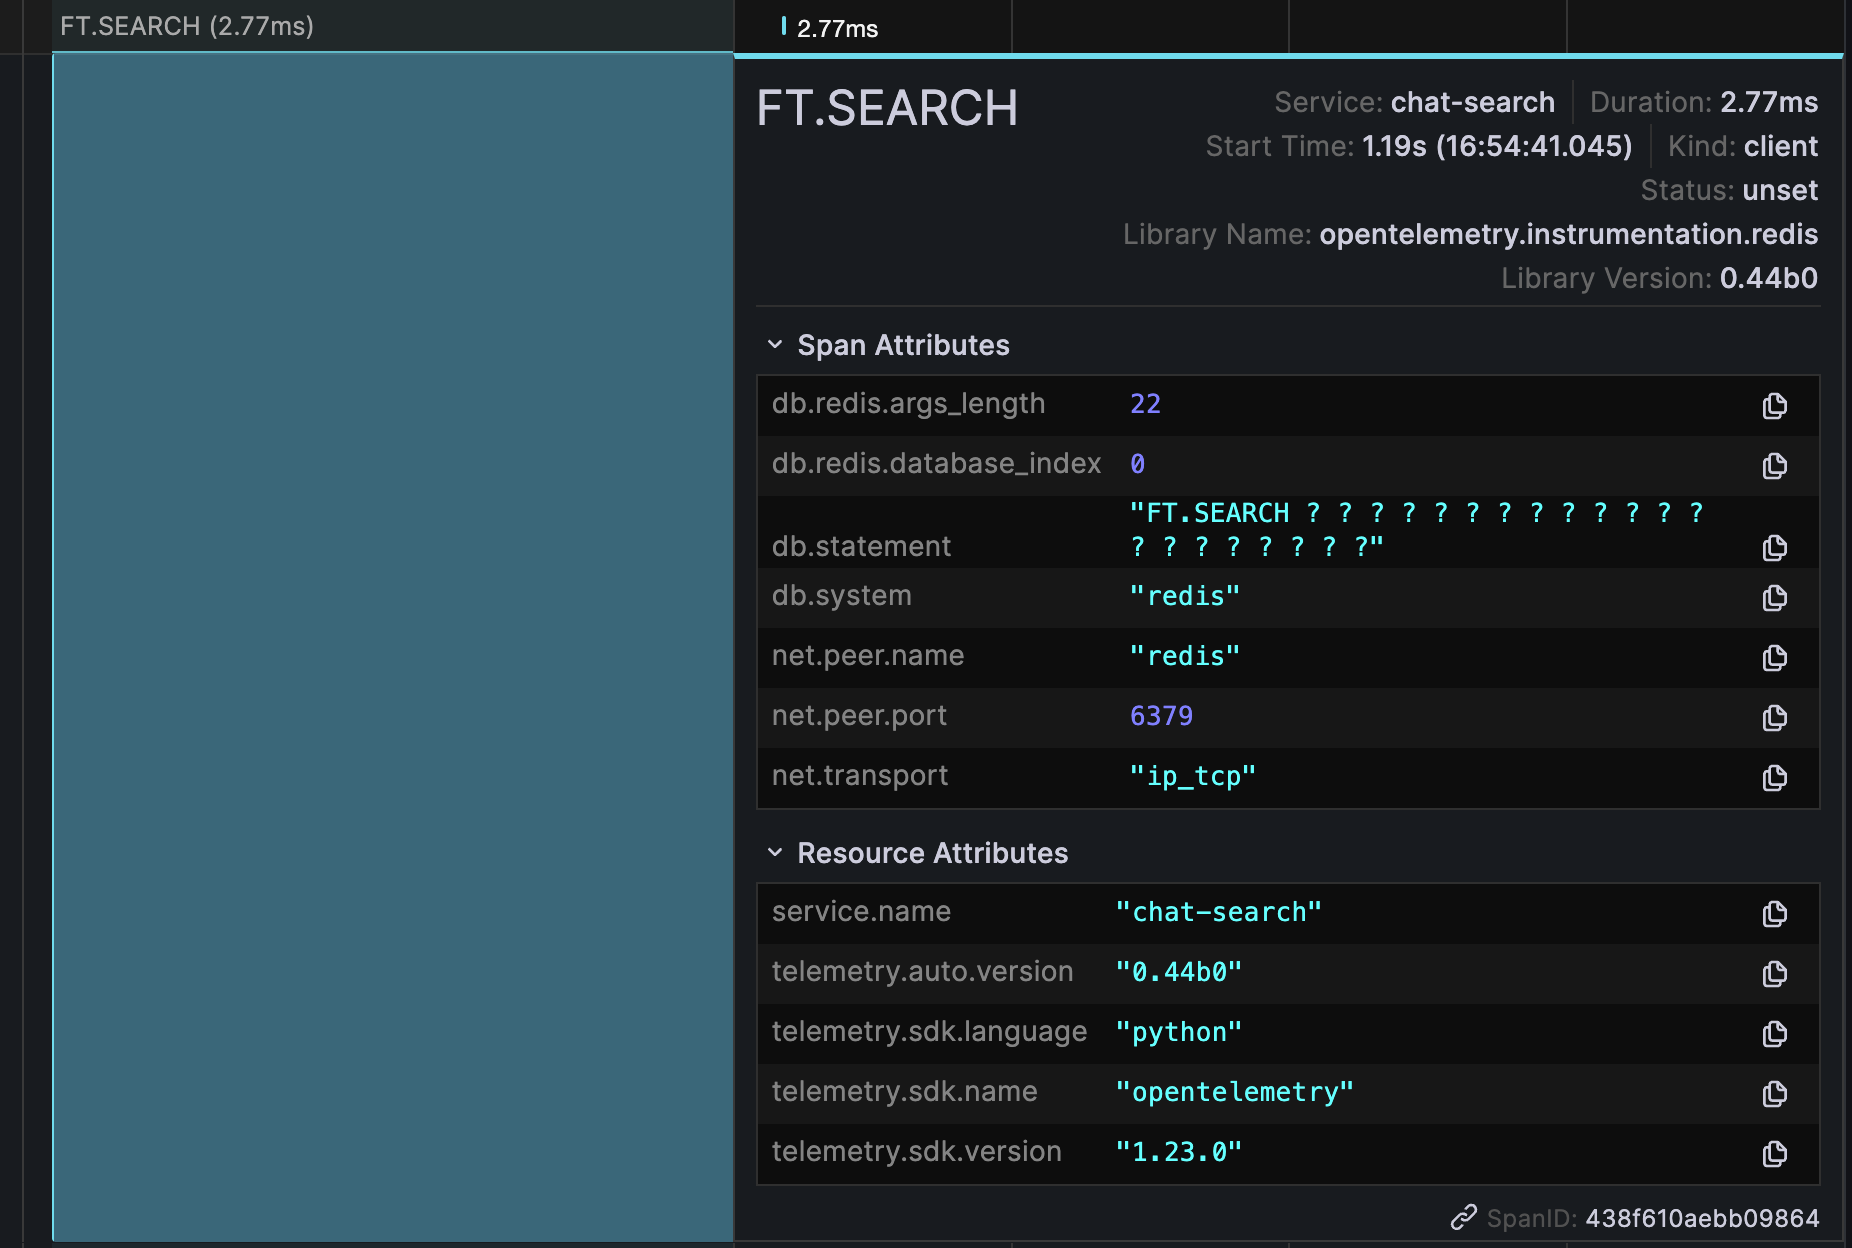
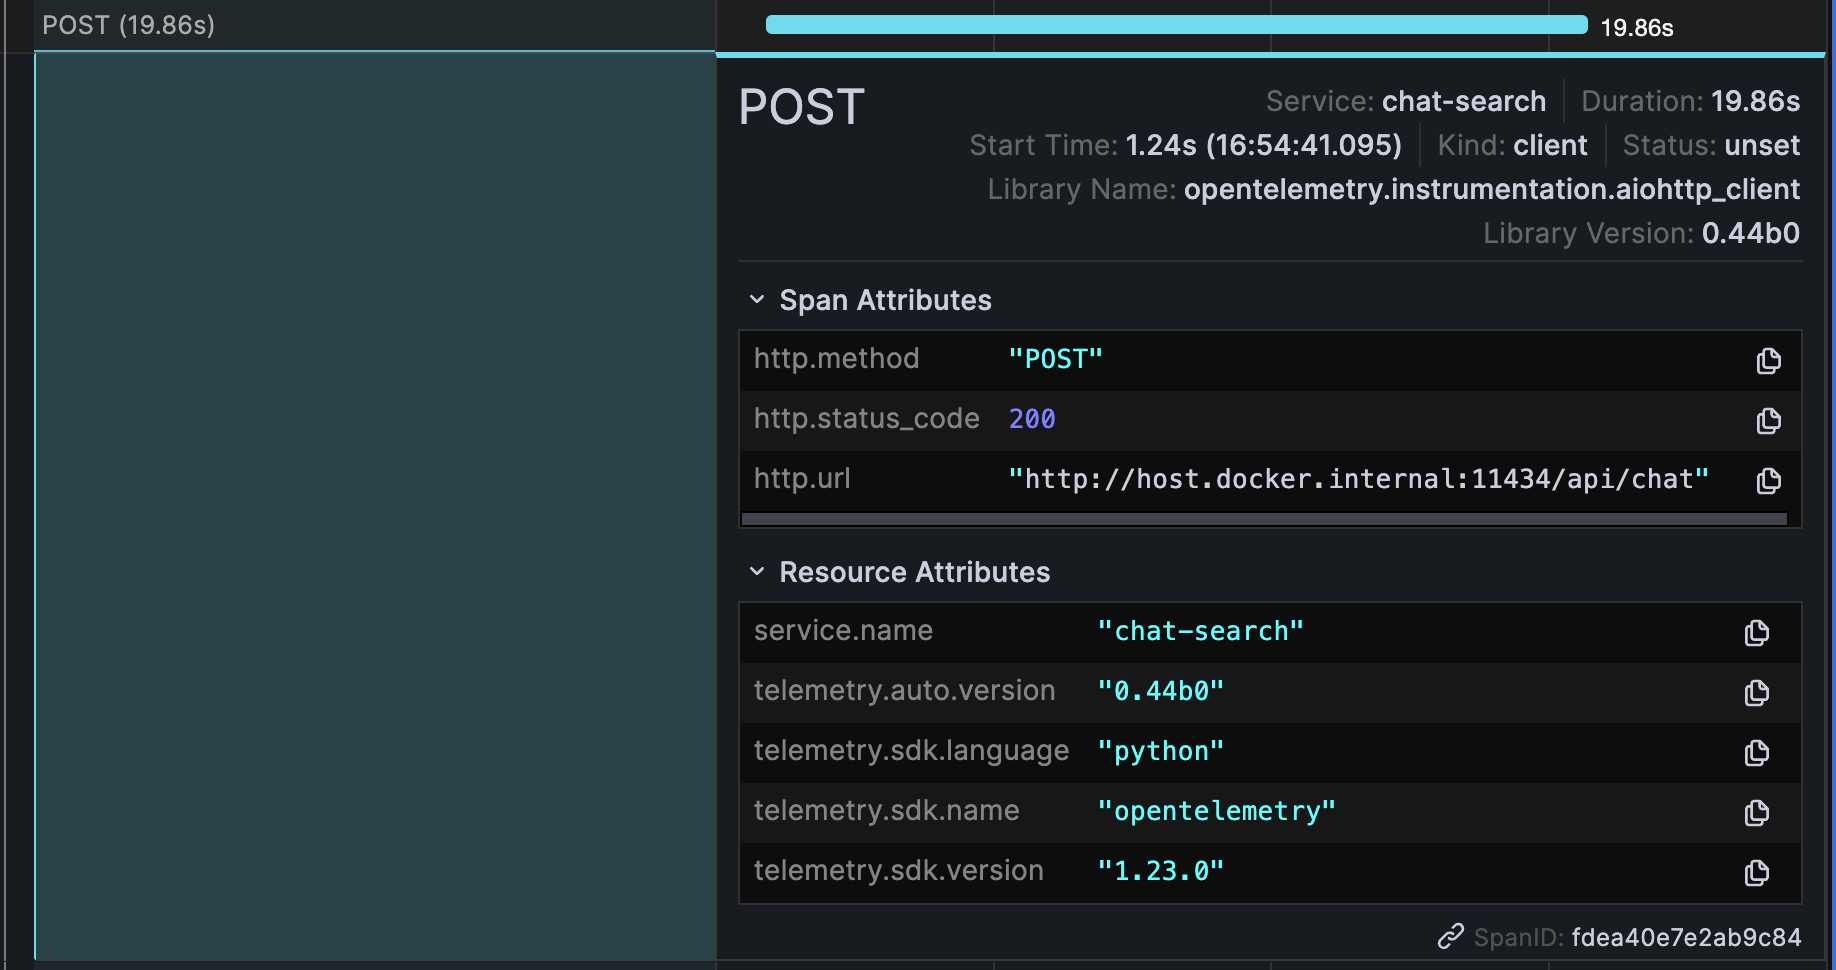
Then ask a question in chat playground and explore tempo traces in grafana.
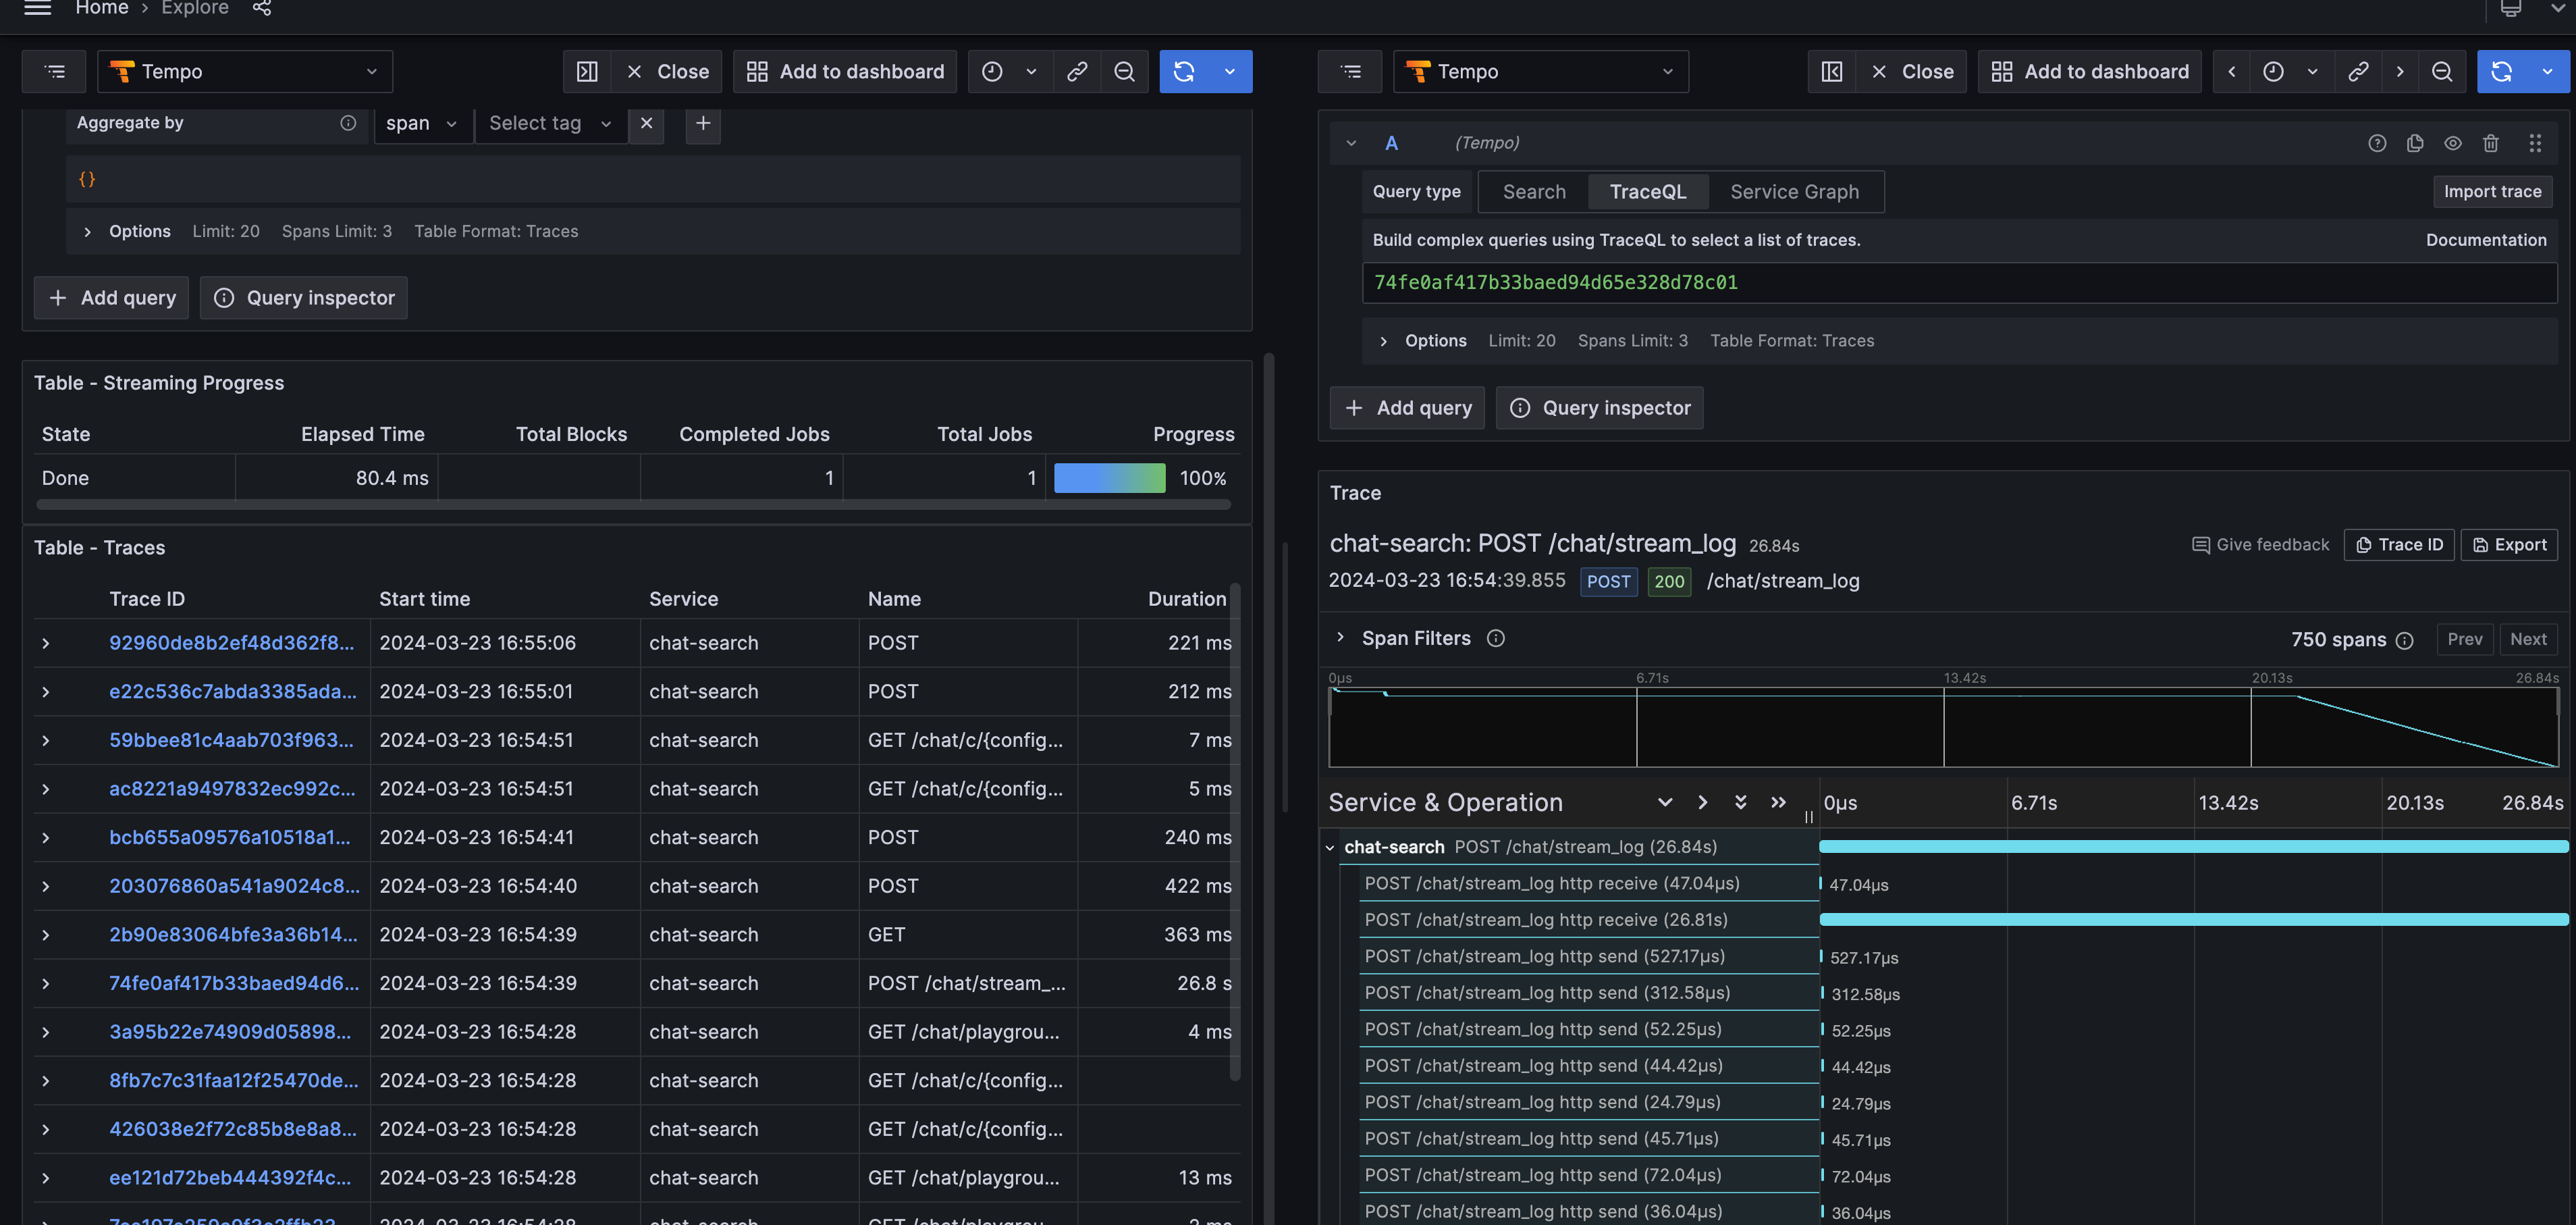
We can inspect redis query and request to LLM model.
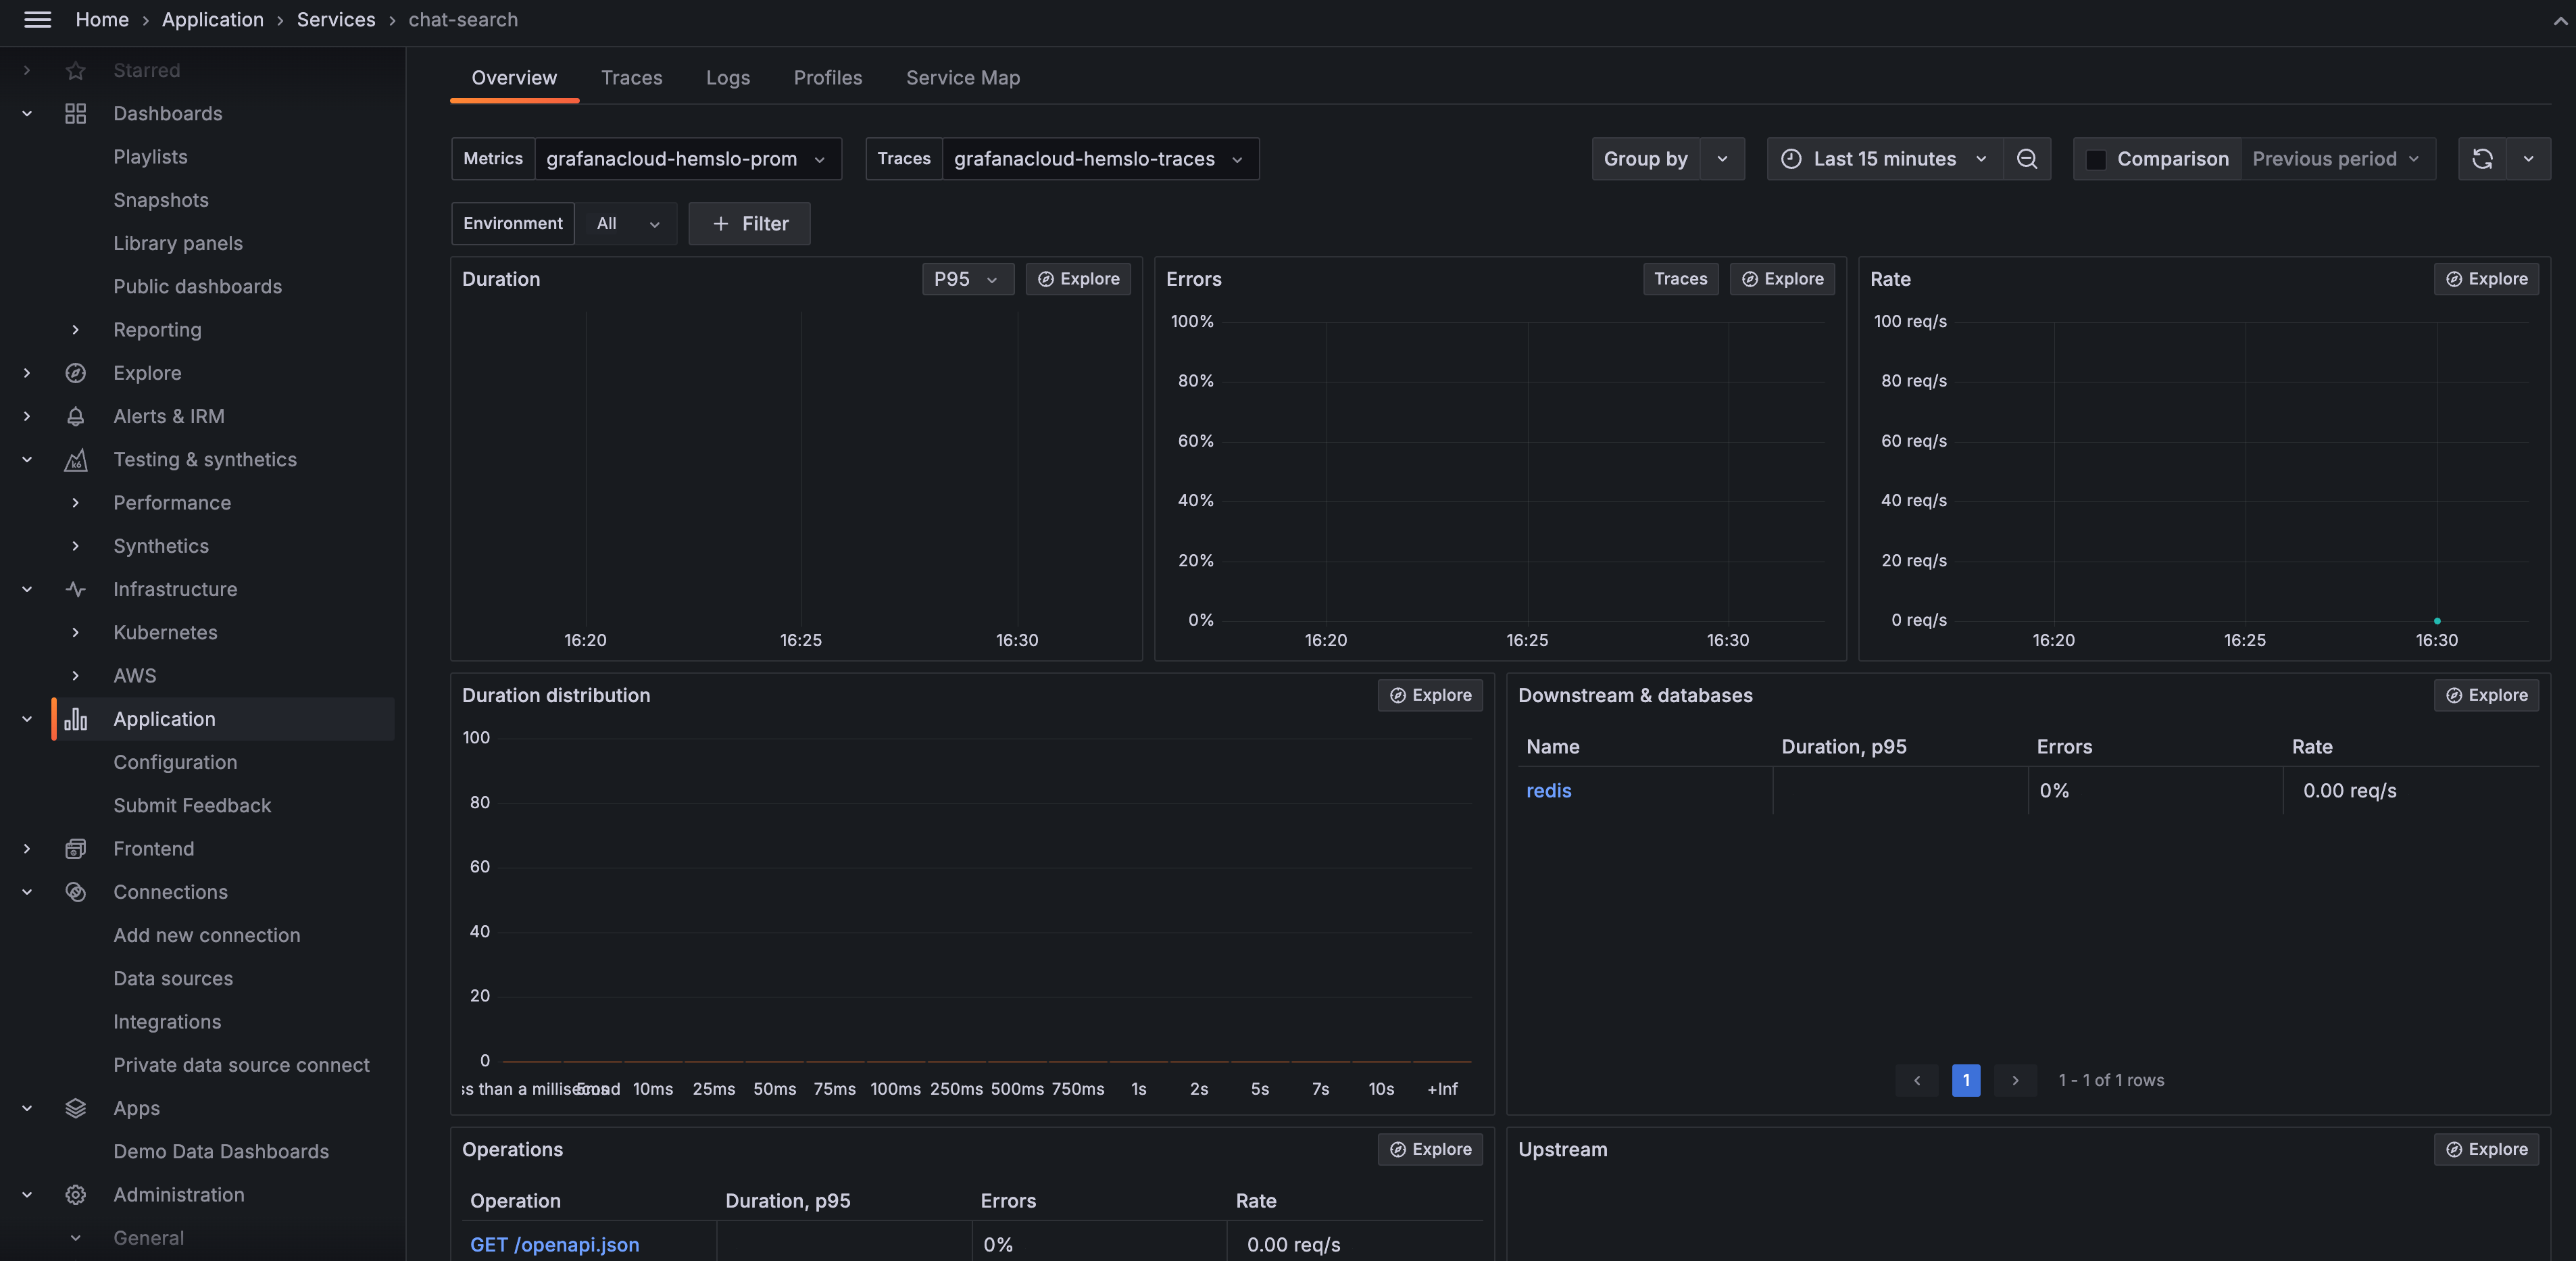
If export to grafana cloud, there is a default application dashboard to view them all.
Pyroscope
Sometimes the performance issue is not in the network or external services, but in the code itself. During development we can use local profiling tools to diagnose them, while in production, it’s not easy to attach the profiler to the running process, thus we need continuous profiling.
Pyroscope is a continuous profiling tool. It can be used to locate performance issues down to the line of code. For python, some config in code is needed.
pip install pyroscope-io
import pyroscope

pyroscope.configure(
    application_name="app_name",
    server_address="http://pyroscope:4040",
)
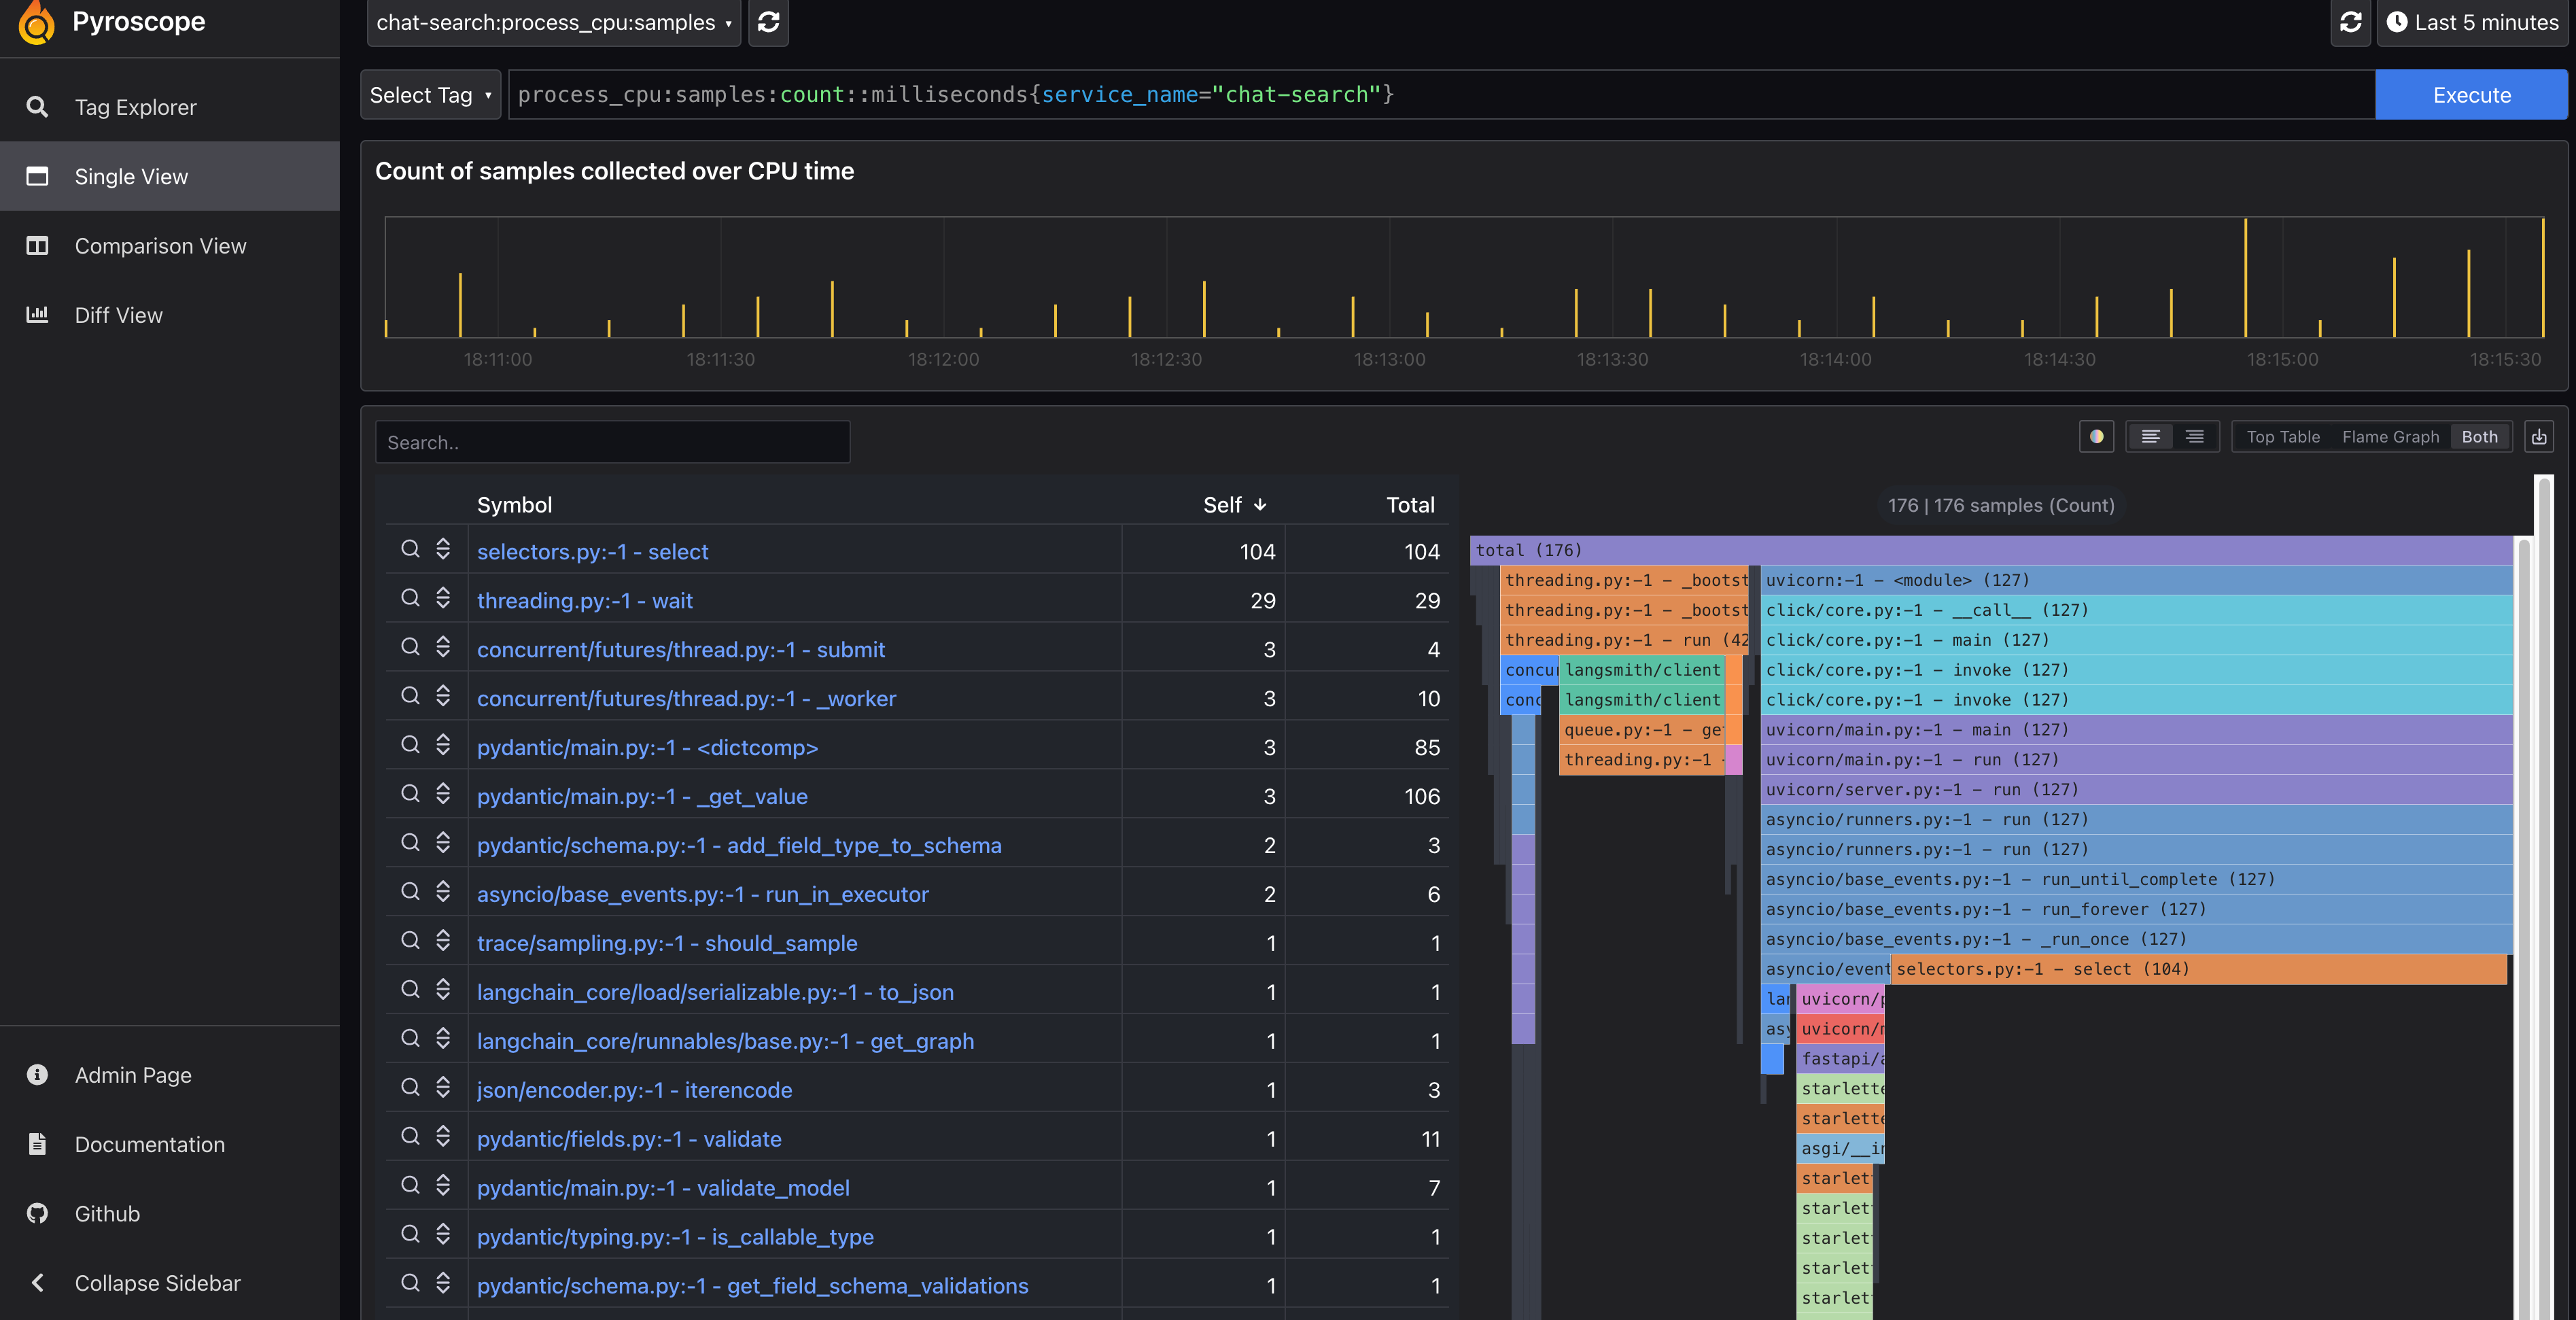
Then the flame graph can be viewed in pyroscope UI.
LangSmith
An unique part of AI application observability is LLM observability. For example in LangChain chain, the response of model can be used to do many things, can be directly shown to user, or be the input next step, or even be used to decide the next step in the control flow. Thus monitoring the full lifecycle of a chain is very important.
LangSmith is a platform for LLM observability. It has built-in support for LangChain, can be used to monitor all interactions with models.
To enable LangSmith, just set environment variables
export LANGCHAIN_TRACING_V2=true
export LANGCHAIN_API_KEY=<your-api-key>
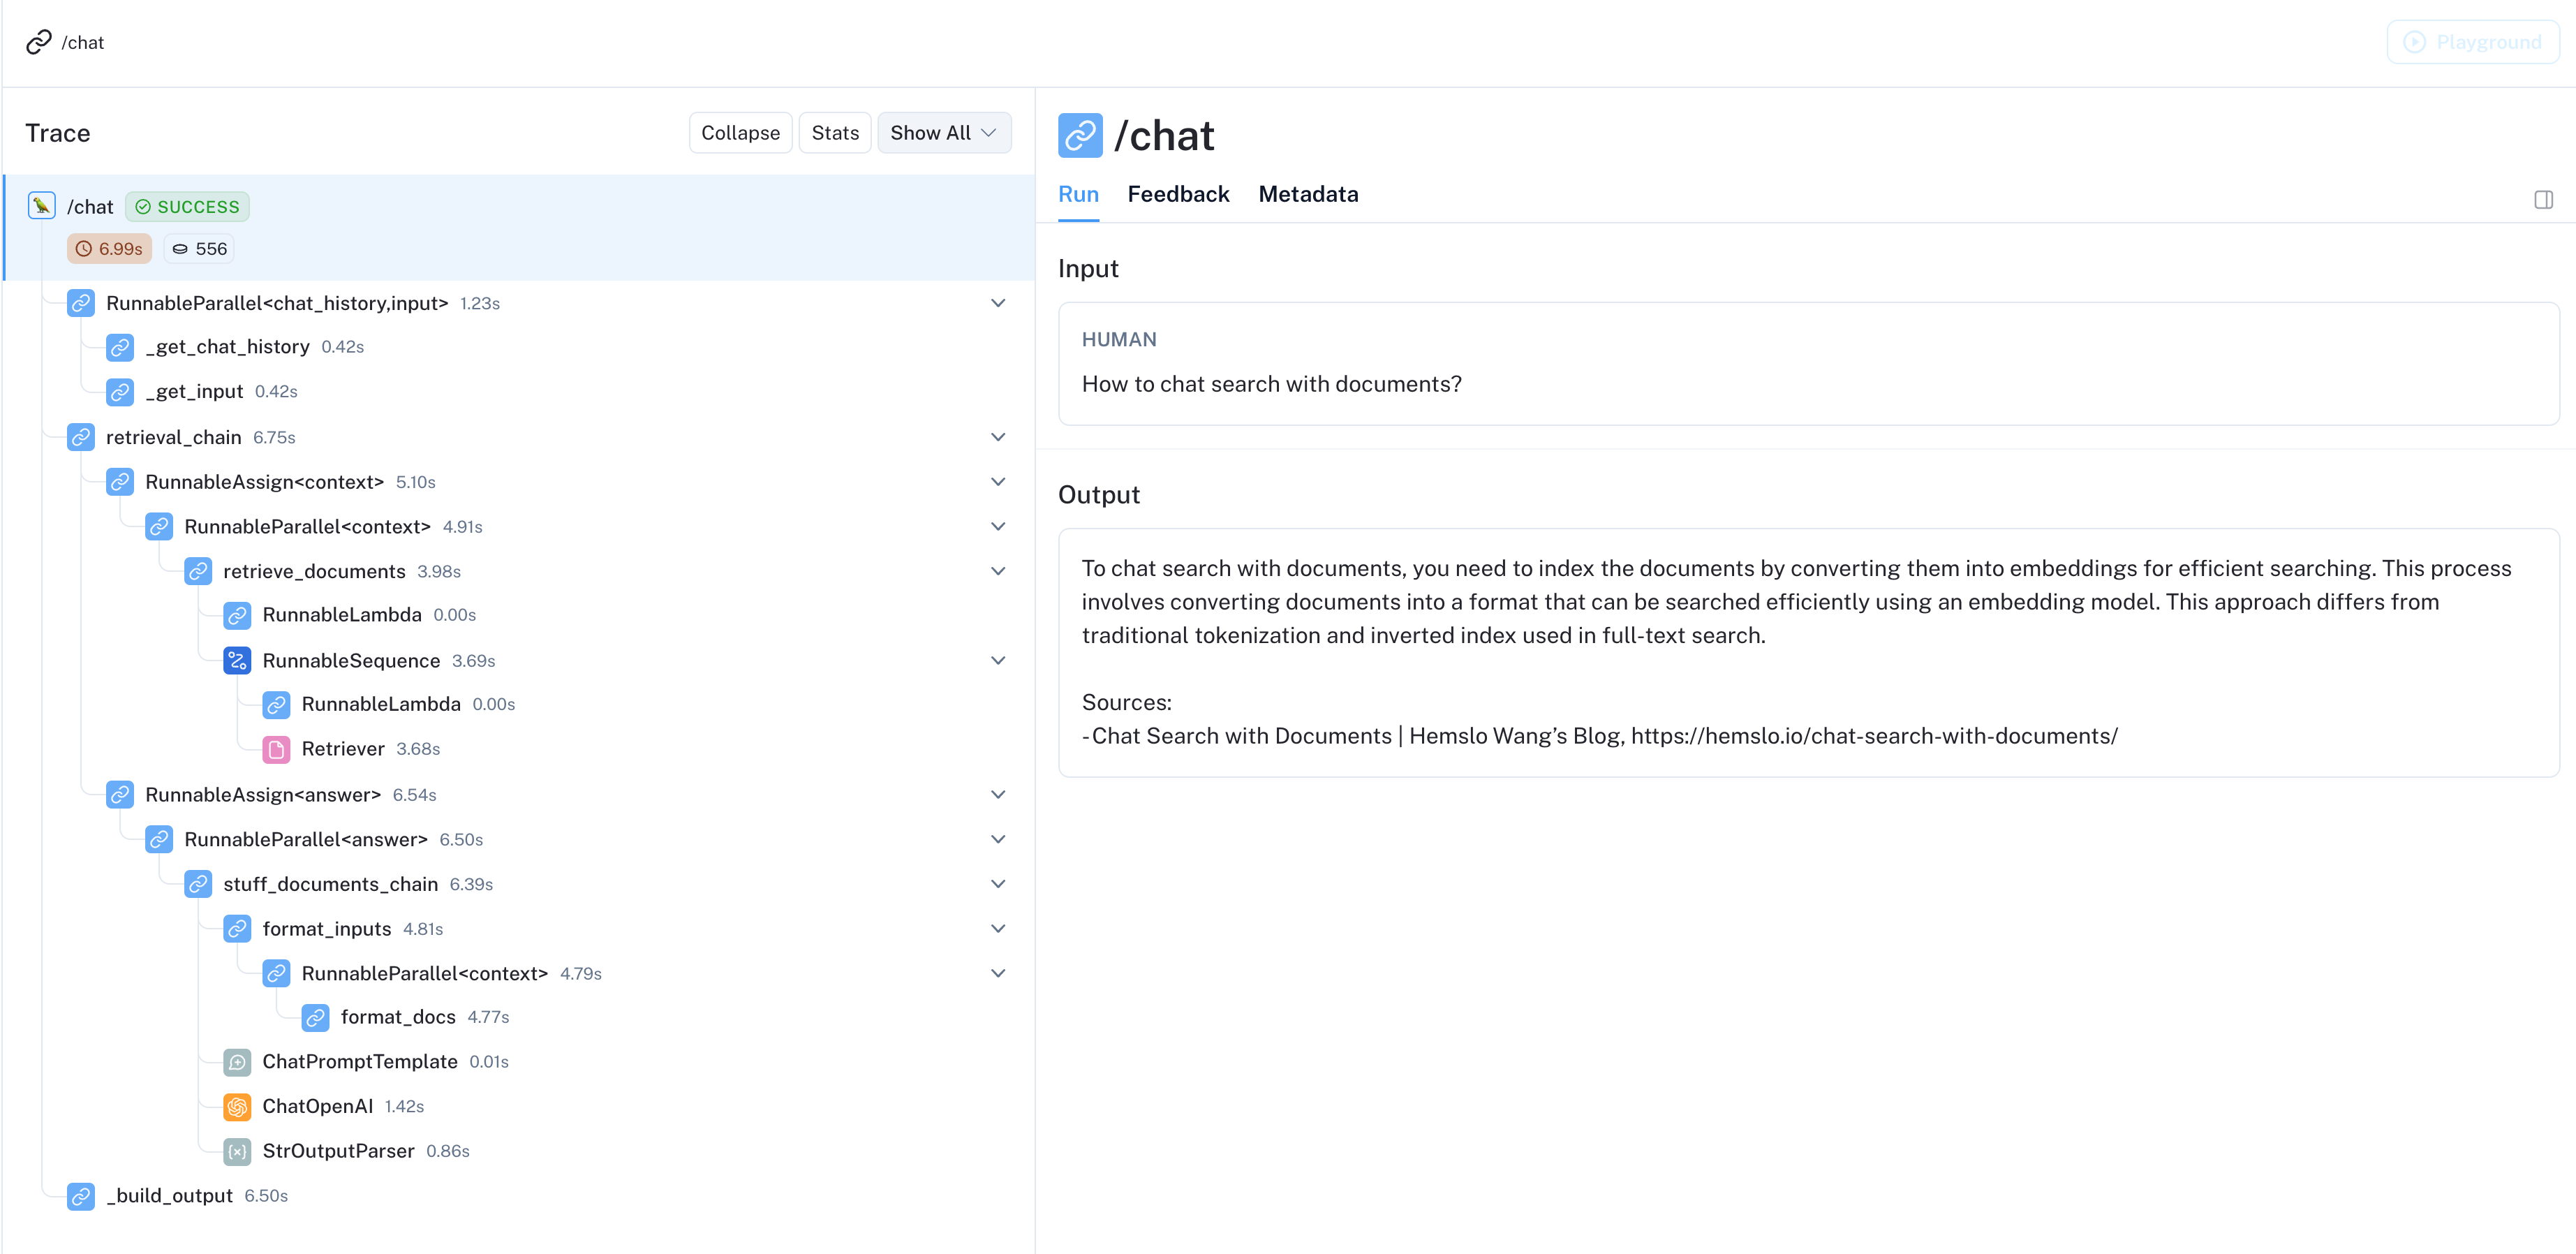
Then check the LangSmith UI for traces. Here is a public demo for my blog chatbot.
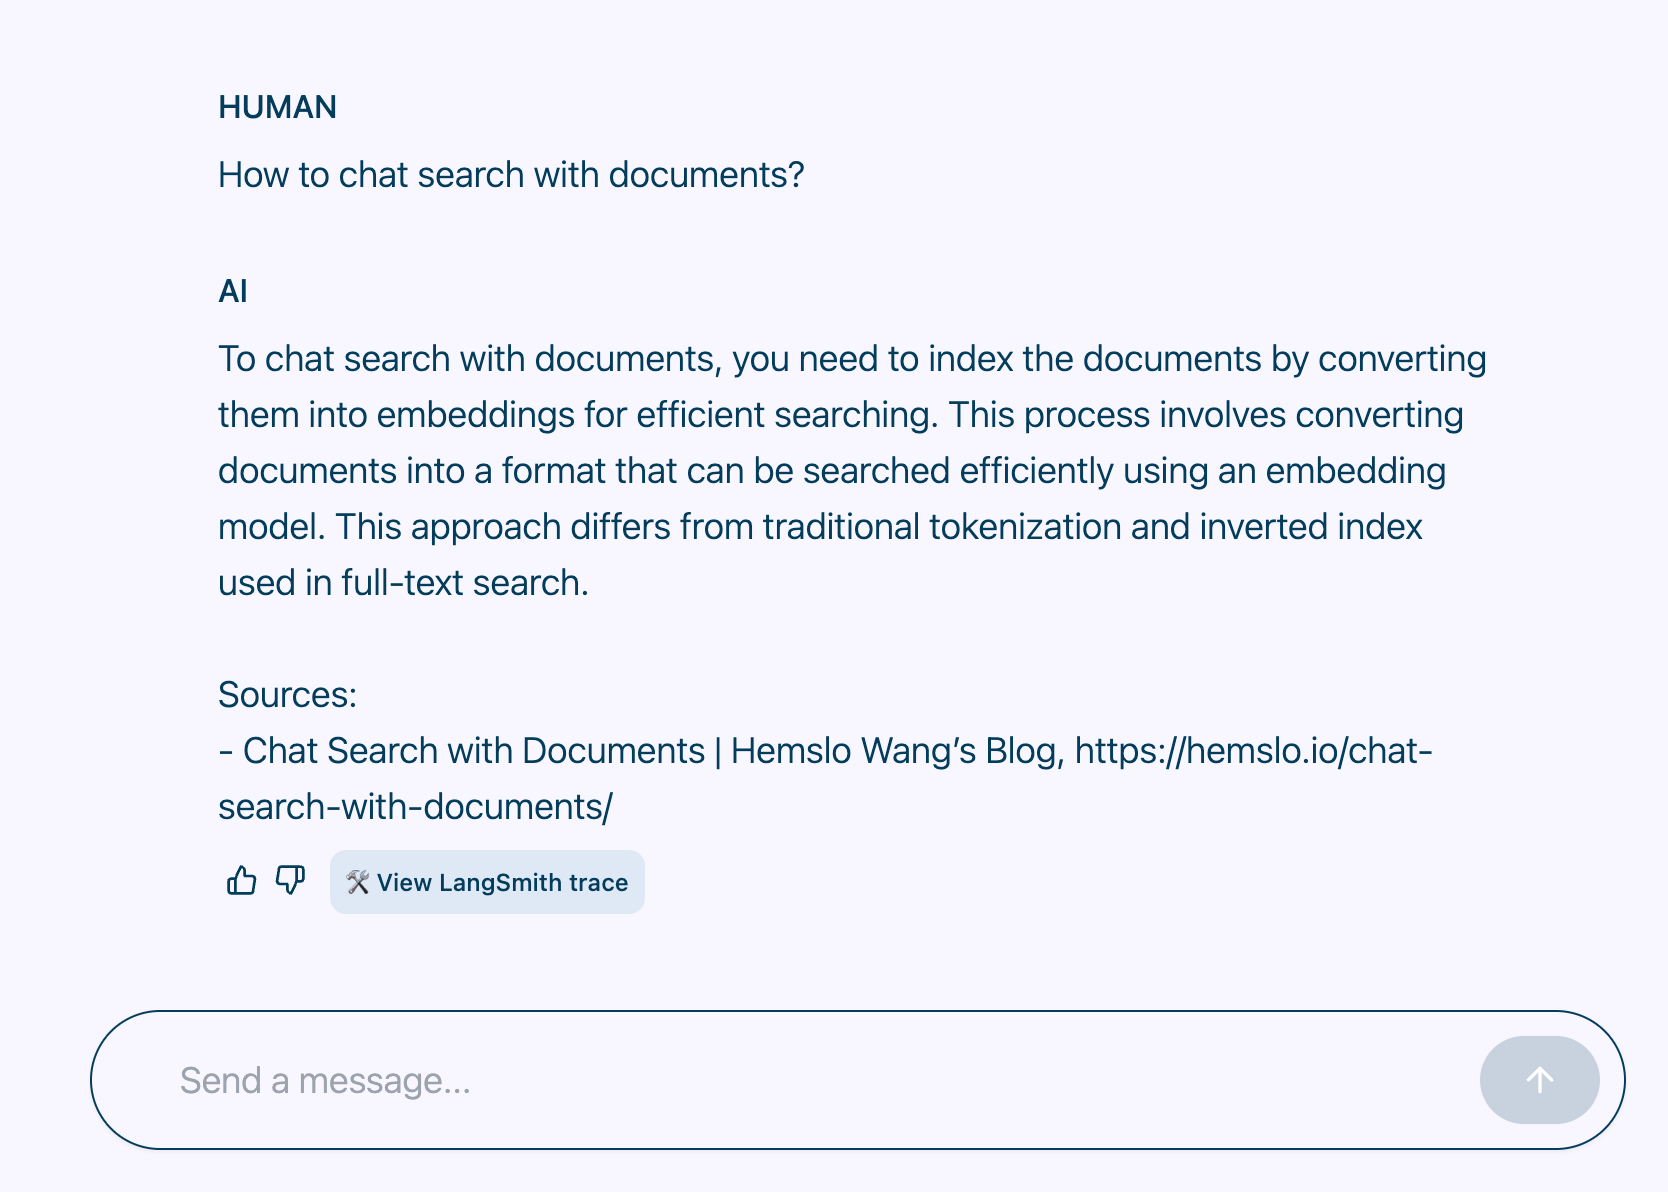
Then click View LangSmith trace to see the trace.
Conclusion
AI application observability is not easy, but with several tools like OpenTelemetry, Pyroscope, LangSmith combined, we can have multi-dimension views of the application.