Implement racket/trace Like Observability Using eBPF
Background
I’m reading the new JavaScript version of SICP, there is an exercise about
drawing the tree recursion process, Exercise 1.14.
In the previous MIT Scheme version, we can use trace to print that flow.
It’s also available in Racket, can be used like this:
#lang sicp

(#%require racket/trace)

(define (fib n)
  (if (< n 2)
      n
      (+ (fib (- n 1)) (fib (- n 2)))))

(trace fib)
(fib 4)
the output is:
>{fib 4}
> {fib 3}
> >{fib 2}
> > {fib 1}
< < 1
> > {fib 0}
< < 0
< <1
> >{fib 1}
< <1
< 2
> {fib 2}
> >{fib 1}
< <1
> >{fib 0}
< <0
< 1
<3
3
It’s very useful for understanding the recursive process. Unfortunately, it’s not available in most languages. I’m curious if we can implement something similar using eBPF. It turns out we can, but with some limitations. It’s easy for compiled languages like C or Go, but hard for JIT/interpreted ones like Java or Node.js.
In this post, I will show you how to implement a simple version of trace
using eBPF, and visualize the call stack.
C
Let’s start with C, rewrite fib:
#include <stdio.h>

int fib(int n)
{
    return n < 2 ? n : fib(n - 1) + fib(n - 2);
}

void main(void)
{
    int n = 10;
    int res = fib(n);
    printf("fib(%d) = %d\n", n, res);
}
$ gcc fib.c -o fib
$ ./fib
fib(4) = 3
To implement trace, we need to know when a function is called and when it returns.
It can be done by using uprobe and uretprobe in
bpftrace.
Find function symbol in C
First we need to verify the function symbol:
$ objdump -t fib | grep fib
fib:     file format elf64-x86-64
0000000000000000 l    df *ABS*  0000000000000000              fib.c
0000000000001149 g     F .text  000000000000003f              fib
So fib is the one we want, as we expected.
uprobe in C
Trace the function call parameters using uprobe:
$ sudo bpftrace -e 'uprobe:./fib:fib { printf("arg0: %d\n", arg0); }'
Attaching 1 probe...
In another terminal, run the program:
./fib
The output of bpftrace is
arg0: 4
arg0: 3
arg0: 2
arg0: 1
arg0: 0
arg0: 1
arg0: 2
arg0: 1
arg0: 0
uretprobe in C
Trace the function return value using uretprobe:
$ sudo bpftrace -e 'uretprobe:./fib:fib { printf("ret: %d\n", retval); }'
Attaching 1 probe...
In another terminal, run the program:
./fib
The output of bpftrace is
ret: 1
ret: 0
ret: 1
ret: 1
ret: 2
ret: 1
ret: 0
ret: 1
ret: 3
Combine uprobe and uretprobe
Now we can combine them together:
$ sudo bpftrace -e 'uprobe:./fib:fib { printf("fib(%d) = \n", arg0); } uretprobe:./fib:fib { printf("%d\n", retval)}'
Attaching 2 probes...
fib(4)
fib(3)
fib(2)
fib(1)
= 1
fib(0)
= 0
= 1
fib(1)
= 1
= 2
fib(2)
fib(1)
= 1
fib(0)
= 0
= 1
= 3
It’s almost what we want, leave pretty visualization later.
Go
Can we do the same thing in Go?
First, rewrite fib in Go:
package main

import (
    "fmt"
)

func fib(n int) int {
    if n < 2 {
        return n
    }
    return fib(n - 1) + fib(n - 2)
}

func main() {
    n := 4
    res := fib(n)
    fmt.Printf("fib(%d) = %d\n", n, res)
}
go build fib.go
Find function symbol in Go
$ objdump -t fib | grep fib
fib:     file format elf64-x86-64
000000000047f560 g     F .text  000000000000006e main.fib
main.fib is what we want.
uprobe in Go
$ sudo bpftrace -e 'uprobe:./fib:main.fib { printf("arg0: %d\n", arg0); }'
Attaching 1 probe...
arg0: 0
arg0: 0
arg0: 8608
arg0: 8608
arg0: 8608
arg0: 8608
arg0: 8608
arg0: 8608
arg0: 8608
arg0: 8608
arg0: 8608
arg0: 8608
arg0: 8608
Oops, we got some unexpected output. Let’s do further investigations.
Disassemble the function:
objdump -d fib > fib.asm
Here are some highlights:
000000000047f560 <main.fib>:
  ...
  47f574: 48 83 f8 02           cmp    $0x2,%rax
  47f578: 7d 0a                 jge    47f584 <main.fib+0x24>
  47f57a: 48 8b 6c 24 10        mov    0x10(%rsp),%rbp
  47f57f: 48 83 c4 18           add    $0x18,%rsp
  47f583: c3                    ret
  ...

000000000047f5e0 <main.main>:
  ...
  47f5f8: b8 04 00 00 00        mov    $0x4,%eax
  47f5fd: 0f 1f 00              nopl   (%rax)
  47f600: e8 5b ff ff ff        call   47f560 <main.fib>
  47f605: 48 89 44 24 38        mov    %rax,0x38(%rsp)
  ...
If you are familiar with C ABI, you may notice something different here.
The first argument of fib is passed in %rax, not %rdi.
Go has a different calling convention than C, doc
here.
The amd64 architecture uses the following sequence of 9 registers for integer arguments and results: RAX, RBX, RCX, RDI, RSI, R8, R9, R10, R11
We can verify it using gdb:
$ gdb ./fib
(gdb) b main.fib
(gdb) r
(gdb) i r
rax            0x4                 4
rbx            0x0                 0
rcx            0x0                 0
rdx            0x49de88            4841096
rsi            0x1                 1
rdi            0x0                 0
...
We can see that rax is 0x4, which is the first argument of fib, rdi is 0x0.
We can continue twice, then check again.
(gdb) c
(gdb) c
(gdb) i r
rax            0x3                 3
rbx            0x47f5c7            4715975
rcx            0xc000186000        824635318272
rdx            0x0                 0
rsi            0x0                 0
rdi            0xc0000021a0        824633729440
...
rdi is 0xc0000021a0, if we grab the last 4 bytes, it’s 0x21a0, which is 8608 in decimal.
$ python3 -c 'print(int("0x21a0", 0))'
8608
You may get different values on your machine, but the idea is the same.
Now we solved mystery of arg0: 8608, how can we get the correct value?
bpftrace support reading register values using
reg.
$ sudo bpftrace -e 'uprobe:./fib:main.fib { printf("arg0: %d\n", reg("ax")); }'
Attaching 1 probe...
arg0: 4
arg0: 3
arg0: 2
arg0: 2
arg0: 1
arg0: 1
arg0: 0
arg0: 1
arg0: 2
arg0: 1
arg0: 0
arg0: 0
So the final command is:
$ sudo bpftrace -e 'uprobe:./fib:main.fib { printf("fib(%d) = \n", reg("ax")); } uretprobe:./fib:main.fib { printf("%d\n", retval)}'
Attaching 2 probes...
fib(4)
fib(3)
fib(2)
fib(2)
fib(1)
= 1
fib(0)
= 0
= 1
= 1
fib(1)
= 1
= 2
fib(2)
fib(1)
fib(1)
= 1
= 1
fib(0)
= 0
= 1
= 3
Note this only works for Go 1.17+, because Go 1.17 switched to register-based ABI, see here. For older Go versions, arguments are passed in stack, we need to use sargN to inspect them.
Trace-viewer
There are many tools to visualize the stack trace, like FlameGraph.
But there is one tool you probably already have, Trace-viewer.
It’s available in Chrome by visiting chrome://tracing/.
The supported trace event format is documented here.
We will use Duration Events for this example.
To include all info for trace viewer, the bpftrace command become a little bit longer,
so I put it in a file fib.bt:
#!/usr/bin/env bpftrace

uprobe:./fib:fib {
    printf(">,%d,%d,%d,%d\n", arg0, elapsed / 1000, pid, tid);
}

uretprobe:./fib:fib {
    printf("<,%d,%d,%d,%d\n", retval, elapsed / 1000, pid, tid);
}
bpftrace also support json output, so we can get trace using:
sudo ./fib.bt -f json > trace.jsonl
The file is like this:
{"type": "attached_probes", "data": {"probes": 2}}
{"type": "printf", "data": ">,4,4292644,3837,3837\n"}
{"type": "printf", "data": ">,3,4292918,3837,3837\n"}
...
To convert it to trace viewer format, we can do some python processing bpftrace2trace.py:
#!/usr/bin/env python3

import sys
import json

def main():
    result = []
    for line in sys.stdin:
        if line:
            data = json.loads(line.strip())
            if data['type'] == 'printf':
                type, value, timestamp, pid, tid = data['data'].strip().split(',')
                args = { 'arg0': int(value) } if type == '>' else { 'ret': int(value) }
                result.append({
                    'ph': 'B' if type == '>' else 'E',
                    'name': f'fib({value})' if type == '>' else '',
                    'ts': int(timestamp),
                    'pid': int(pid),
                    'tid': int(tid),
                    'args': args,
                })
    print(json.dumps(result))

if __name__ == '__main__':
    main()
Then we can get the trace viewer format:
./bpftrace2trace.py < trace.jsonl > trace.json
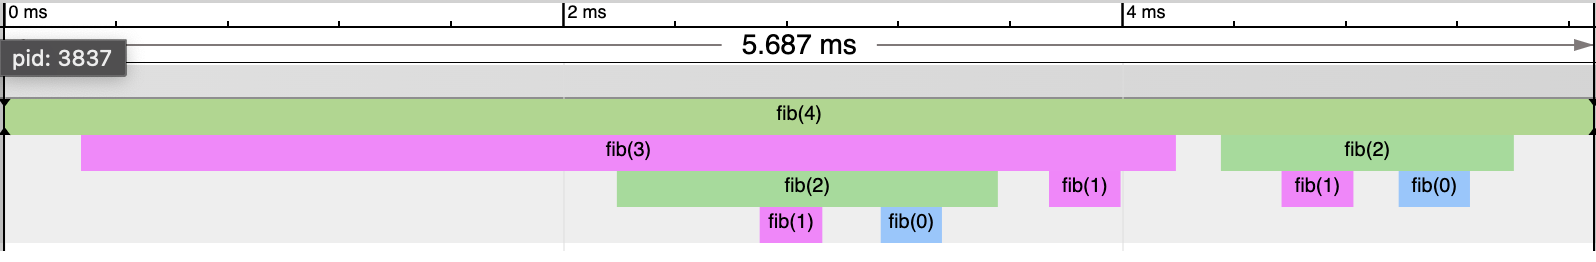
Load file in chrome://tracing/, we can see the trace:
Conclusion
With the help of eBPF, we can trace function calls without modifying the source code.
We only covered compiled languages here, and it depends on language specific ABI to work.
For other languages, uprobe or uretprobe may not work, there are other ways to trace them,
like USDT, but they require language specific support.
Chrome trace viewer is a handy tool to visualize trace, the format is simple and easy to generate. It’s a good addition to observability toolbox.
All the code for this post is available at this gist.